How can enterprises better control their supply chains? How does one know if the supply chain is under control in the first place?
A soy sauce manufacturer bragged about its wonderful customer service numbers. The manufacturer showed charts that it was delivering 98% of orders on-time and complete. There was no problem with quality as there was barely any rejections from customers.
Customers, however, were telling a different story. The manufacturer’s largest buyer, a supermarket chain, complained that orders were arriving at merely 65% of the time. Fill-rates or order completeness was averaging 50%, i.e., the corporation was delivering only half of the supermarket’s orders.
It was even worse with product quality. Soy sauce sachets were leaking at the supermarket’s shelves. The supermarket chain was pulling out damaged sachets every day.
This is a true-to-life story and one that is repeated countless times not only at supermarkets but across industries. An enterprise boasts outstanding sales numbers, excellent customer service, and second-to-none product quality. Customers in the meantime grumble about poor service and unsatisfactory quality and frequent out-of-stock. Who’s right and who’s wrong? Clearly there’s conflict and something should be done.
Supply chains are product and service streams in which materials flow, transform, and advance in value from their origins (sources) to their final stage as finished goods. A supply chain’s aim is to deliver products and services correctly and consistently. Correctly means delivering the right products and services that match customer demand and expectations. Consistently means delivering products and services correctly all the time.
To do things correctly and consistently, there has to be control. Control is the influencing and regulating of activities, the critical ones especially, to attain discipline in desired results.
Many firms, particular those that do manufacturing, utilise statistical methods to keep operations under control. One prominent method is the control chart.
Control charts makes visible the actual behaviour of operations versus what we would normally expect of them. The theory behind control charts is that results of most operations would follow a standard normal pattern, what statisticians call a normal distribution. Products as they are made would have characteristics that tend toward an average result. The variations between individual products would also follow an expected range, which statisticians measure as the standard deviation.
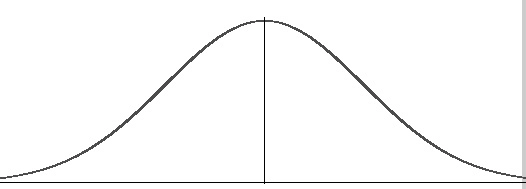
If items exhibit results that stray far from the average, that is, beyond the normal distribution curve, then chances are the operations making available the items have become erratic, or in other words, they are going out of control.
In the case of the supermarket chain and the issue of leaking soy sauce sachets, control charts can track the number of leaky sachets:
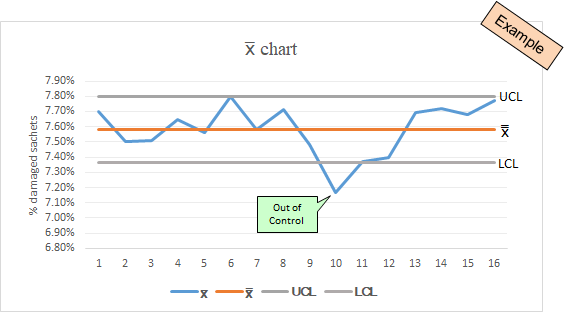
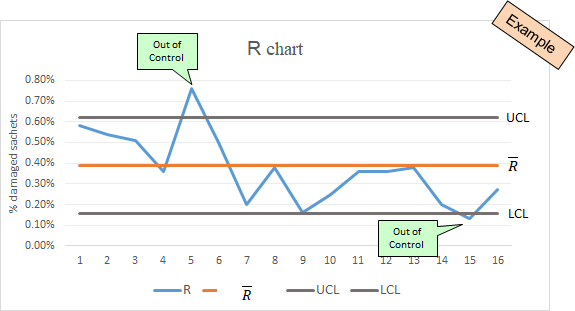
The control charts above are examples of what the leaky sachets can be like at the supermarket’s shelves every day of the week for sixteen (16) weeks. The control charts track the weekly average percentage of damaged sachets as well as the range or widest difference between daily samples.
The x̅ (average percentage) control chart shows close to an average 7.4% in leaking sachets while the R (range) chart shows an average variation of 0.4% between daily samples from each week.
Right away, management of both the supermarket chain and the manufacturing enterprise can see that at least 7 out of every 100 sachets are leaking on the shelves every week. For the soy sauce manufacturer’s executives, who pride themselves on their company’s reputation for zero defects, this is unacceptable.
But the point of the control charts wasn’t just to indicate how many sachets are leaking. The control charts showed that the percentage of leaking sachets was averaging 7.4% to 7.8%. The range (R) chart illustrates this variation, as differences between items varied at an average of 0.4%. This meant daily damaged sachets kept to a steady range between 7% to 8% of total.
There was an instance where one week’s average dropped to 7.2% and fell outside the control chart’s limits. Even as a drop in damaged sachets was a welcome sight, it was more of an exception. It wasn’t normal and the damaged average was not in normal control.
There were two (2) weeks in the R chart where variations spiked or narrowed outside the statistically set limits. This indicates samples on those two (2) weeks may have been gathered and computed differently or that operations in each of those two weeks were being done differently.
To put it as simply as possible, sachets are leaking daily at more than 7% average. From the consistency of the damages, one may speculate that the source of the damaged sachets is an operation at the soy sauce manufacturer’s facility.
It was later found that the manufacturer’s sachet packing machines weren’t sealing the soy sauce sachets 100% effectively. The sachets’ seals were deteriorating and opening as soon as the products left the soy sauce manufacturer’s premises. It was recommended the manufacturer refer the problem to their product research department to review packaging specifications and sachet production protocols. It was also suggested that the manufacturer and supermarket chain come up with common quality and service measures.
Control charts can be intimidating given the requirements to compute statistical numbers. But as much as one needs familiarity and initiative to set up control charts, they are not that difficult to make. The hard part usually is in identifying what specification or performance measure to chart.
But once they are established, control charts can be very useful as they provide instant feedback on how consistent and correct operational results are.
The whole point of supply chains is to deliver products and services correctly (matching customer expectations) and consistently (all the time). Being consistent and correct begins with being in control of the supply chain.
