The PSI or Production-Sales-Inventory is a basic spreadsheet template for supply chain planners.
It looks like this:
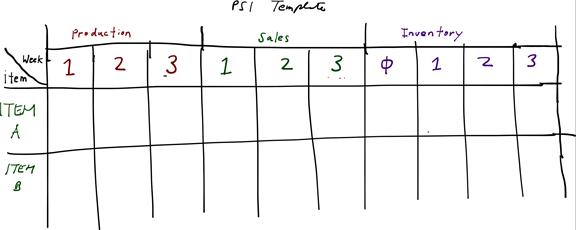
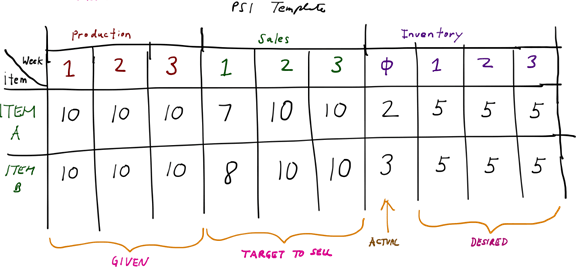
The PSI typically has three sections: production, sales, and inventories.
Production represents the in-flow of an item or what’s going into inventory. A basic example is finished goods input coming from a manufacturing operation’s output. We can also call it supply.
Sales is the out-flow of an item or what’s going out from inventory. An example is a shipment to a customer. We can also call it demand.
Inventory is the stock of an item on-hand in storage, such as how much of an item is in a warehouse.
The PSI makes visible production, shipments, and inventories over a range of time periods or what we can call time-buckets. It’s an outlook for planning. It’s up to the planner if he or she wants to use weeks, months, or even days for the time buckets. It’s also up to the planner how many time buckets to plan for. It doesn’t have to be just three as in the figure below. It can be any number. Some enterprises use six (6) buckets for a 6-month outlook; others go up to 12. It is the planner and his superiors that decide what periods to cover (e.g., weeks, months) and how many.
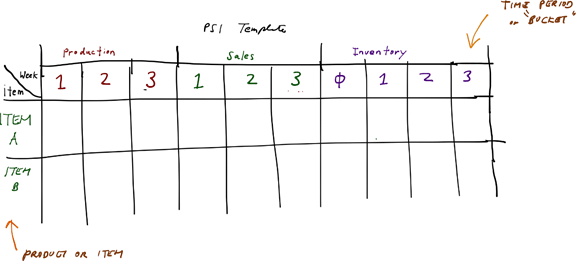
The PSI’s horizontal rows list the items or products. Each row shows the production, shipments, and inventory outlook for each item via the quantities in the respective columns or time buckets.
An item can be a product, material, or a supply or spare part. It is recommended to select an enterprise’s most important items to the PSI. By very important, that would mean those that executives often keep an eye on.
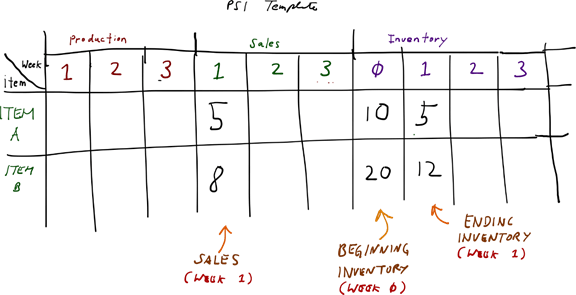
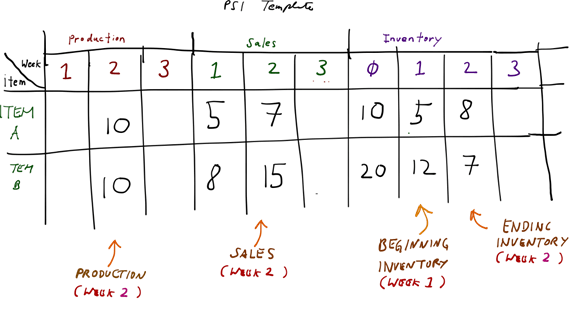
Working the PSI starts with a beginning inventory at the zero (ø) column of the inventory section.
The planner’s basic aim is to track the inventories from one time-bucket to the next. In the figure below, the planner notes that inventories at the end of week 1 becomes fewer as a result of sales in the same week.
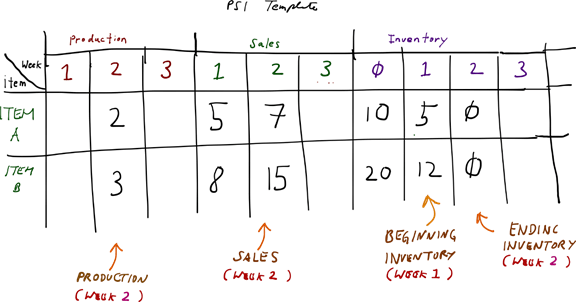
When the planner, however, inputs the production and sales of week 2, the inventories end with zero (ø) on week 2.
To put what I just said in a formula:

and to put it to represent every time bucket:

where x is the time-bucket number.
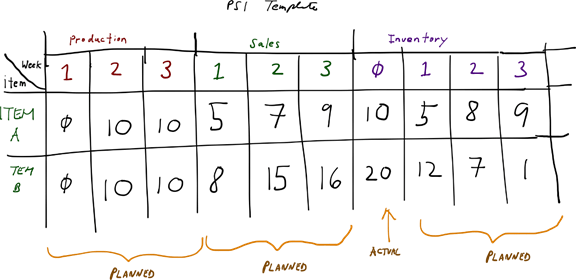
The aim of the supply chain planner is to ensure there will always be available inventory for sales. Hence, supply chain planners typically prefer there’d be extra stock at every time bucket.
Supply chain planners typically set inventory targets for every time-bucket in line with their superiors’ policies and strategies. Sales for each time-bucket usually are based on forecasts and customer orders. From the inventory targets, the planner computes the production or sales needed and still have enough left to meet inventory targets.
Planners focus on either how much to sell or how much to produce to meet inventory targets.
If it’s production, planners would adapt the ending-inventory formula and make it look like this:
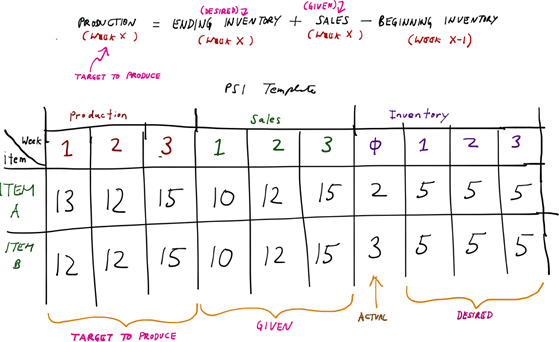
For a desired ending inventory of five (5) units of items A and B, the planner would set production numbers that would match sales but leave at least five units at every ensuing time-bucket.
When the enterprise wants to plan how much of an item to sell given inventory targets and ongoing production, the supply chain planners would adopt the following formula:
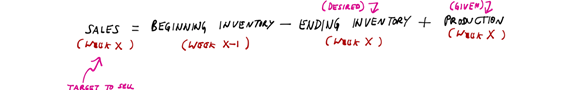
Which in the PSI would look like this:
…which looks just like the PSI for production. 😀
The PSI in the above diagrams shows the same numbers but illustrates a different approach. The planner either figures out how much to produce or calculates how much to sell for the ultimate purpose of having enough inventories at every time-bucket.
The insight here is you can tailor a PSI for your particular business.
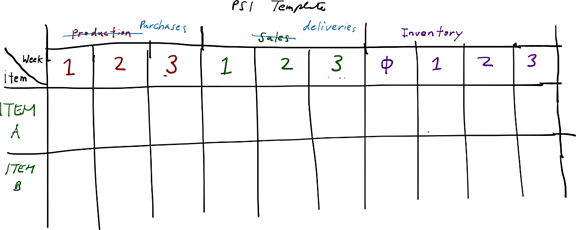
For an enterprise that buys finished goods and directly sells to customers, for instance, a planner can adapt a PSI from a production-sales-inventory template to one that is purchases-deliveries-inventory:
An enterprise that imports items and converts them to finished goods, a PSI may look like the one below.

I found this especially useful in a metals manufacturer that was importing stainless steel coils that then were being cut up and converted into steel sheets, plates, tubes and pipes. As the stainless steel coils were the key components of the manufacturer with their weights in metric tons as the standard of measure, the PSI enabled the manufacturer’s managers to plan the quantities and timing of importing and converting expensive metals without having too much on floor for too long.
When enterprises use a common measure from key materials to finished product, the supply chain planner could expand the PSI to a 4-column spreadsheet consisting of purchases-production-sales-inventories:
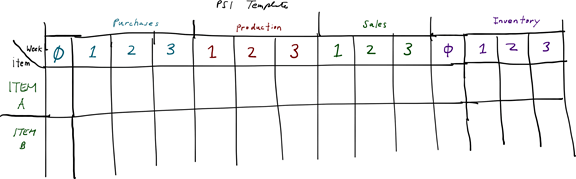
A 4-column PSI would be particularly effective for enterprises with few but predominantly high-volume products such as those in commodities. And it opens up participation of practically the four (4) core disciplines of the supply chain: purchasing, production, logistics, and planning.
The PSI doesn’t require sophisticated software or hardware. One can use an ordinary spreadsheet program (e.g. Excel) or even do it by hand with or without a calculator (or abacus).
The PSI gives visibility to an enterprise’s supply and demand picture from present to future for key items, whether finished goods, materials, or parts.
The PSI’s limit is that the more items an enterprise has, the more tedious it becomes to plan and track. ERP systems coupled with up-and-coming artificial intelligence (AI) software can make up for that. Many enterprises, however, stick to simple spreadsheets to plan the items they carry.
Even with its simplicity and features, it’s hard to find an enterprise that actually uses a PSI. Many planners tend to devise their own templates, using spreadsheets mostly, despite the availability of integrated planning tools provided by expensive software.
Most of the planning spreadsheets I’ve seen are hard to understand or are very specialised. When I present the PSI template to planners, however, I’ve gotten very positive feedback with executives welcoming its application and visibility.
A PSI is a basic manifestation of what a supply chain planner does, which is to plan production or estimate the demand needed with a minimum amount of stock at every time period. It is a basic tool for supply chain planners. It’s simple to set up and provides a comprehensive canvas of what an enterprise’s supply and demand would look like in the present and future. It has its limitations in the complexity of an enterprise’s items and operations. But at the very least, it provides a foundation for planners to manage inventories and optimise supply chain productivity.

One thought on “Behold The PSI: A Basic Tool for Supply Chain Planning”